Car diagnostics graphics play a crucial role in modern vehicle repair and maintenance. These visual representations of complex vehicle data provide technicians and car owners with valuable insights into the health and performance of their vehicles. This comprehensive guide delves into the intricacies of car diagnostics graphic, exploring their significance, types, interpretation, and benefits.
What are Car Diagnostics Graphics?
Car diagnostics graphics are visual representations of data collected from a vehicle’s onboard computer system, known as the Engine Control Unit (ECU). The ECU continuously monitors various systems and components within the vehicle, collecting data from sensors located throughout. This data is then translated into graphs, charts, and other visual formats, allowing technicians to analyze and diagnose potential issues effectively.
Why are Car Diagnostics Graphics Important?
Before the advent of advanced diagnostics, mechanics relied heavily on their experience and intuition to identify car problems. This process was often time-consuming, and pinpointing the root cause of an issue could be challenging. Car diagnostics graphics revolutionized this process by providing concrete visual evidence of a problem.
Here’s why car diagnostics graphics are essential:
- Accurate Diagnosis: By visualizing data, technicians can quickly identify anomalies and patterns, leading to more accurate diagnoses and faster repairs.
- Improved Efficiency: Graphics streamline the troubleshooting process, saving time and reducing labor costs.
- Data-Driven Decisions: Mechanics can make informed repair recommendations based on objective data rather than assumptions.
- Preventative Maintenance: Regular analysis of diagnostics graphics can help identify potential issues before they escalate into major problems.
Types of Car Diagnostics Graphics
Different types of car diagnostics graphics offer unique insights into specific vehicle systems. Some common types include:
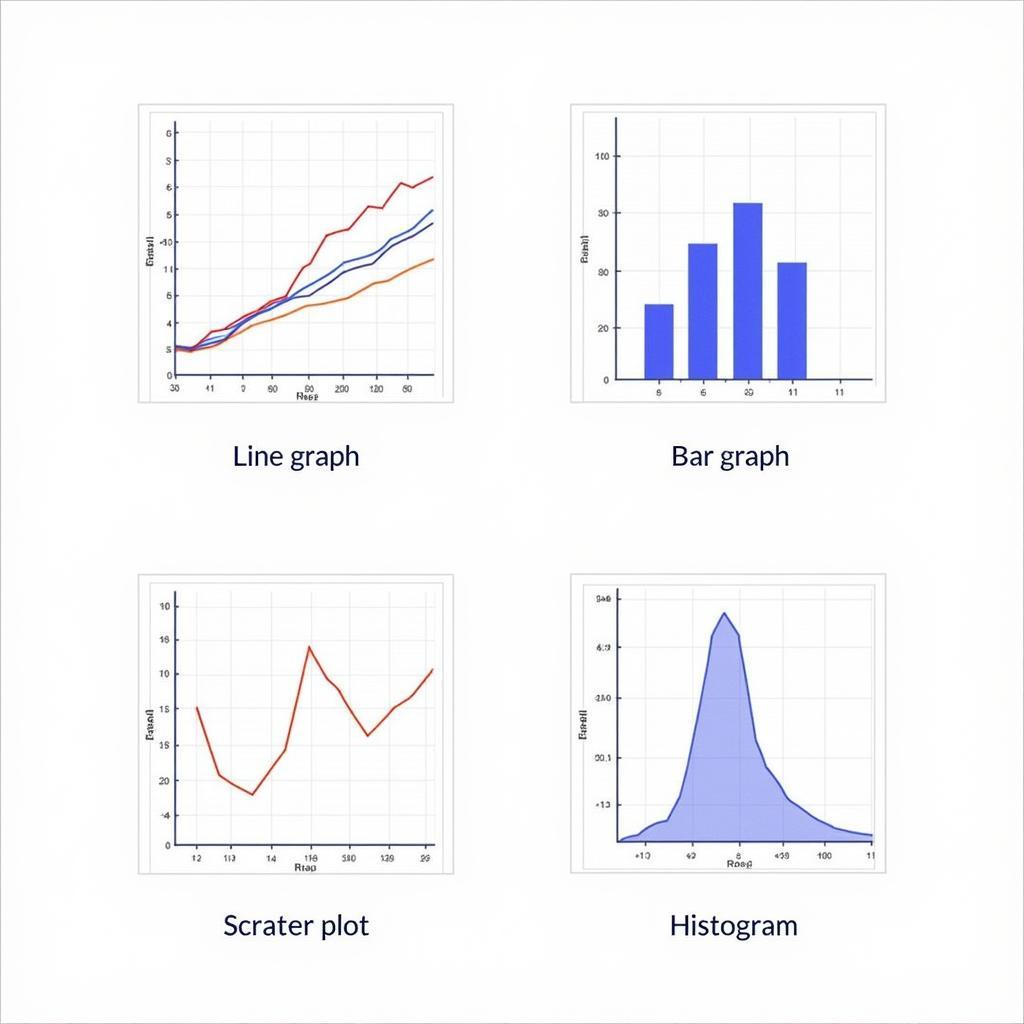
1. Line Graphs
Line graphs are widely used to track changes in various parameters over time.
- Example: A line graph can display engine RPM (revolutions per minute) over a specific period, revealing fluctuations or drops that might indicate an engine problem.
2. Bar Graphs
Bar graphs effectively compare different data sets.
- Example: A mechanic might use a bar graph to compare the fuel efficiency of each cylinder, identifying any imbalances.
3. Scatter Plots
Scatter plots help identify correlations between two variables.
- Example: A scatter plot showing engine load versus fuel consumption can help determine if the engine is operating efficiently.
4. Histograms
Histograms illustrate the distribution of data points.
- Example: A histogram can show the frequency of specific voltage readings from a sensor, helping identify potential sensor malfunctions.
 Various Types of Car Diagnostics Graphics
Interpreting Car Diagnostics Graphics
Interpreting car diagnostics graphics requires specialized knowledge and training. Here’s a simplified breakdown:
- Identify the Parameters: Understand what each axis on the graph represents (e.g., time, RPM, voltage).
- Look for Anomalies: Identify any deviations from the expected or normal range of values.
- Analyze Patterns: Recognize repeating patterns or trends that might indicate an underlying issue.
- Cross-Reference with Codes: Compare graphical data with any fault codes stored in the ECU for a comprehensive diagnosis.
Benefits of Using DiagFixPro for Car Diagnostics Information
DiagFixPro is your trusted source for all things related to car diagnostics. Our website offers a wealth of information, including:
- Detailed Articles: Explore in-depth articles explaining various car diagnostics concepts and techniques.
- Expert Reviews: Find unbiased reviews of the latest car diagnostic tools and software.
- Troubleshooting Guides: Get help identifying and resolving common car problems using our comprehensive guides.
- Industry News: Stay up-to-date on the latest advancements in car diagnostics technology.
Car diagnostic tool volkswagen
Frequently Asked Questions about Car Diagnostics Graphics
1. Can I interpret car diagnostics graphics myself?
While some basic interpretation is possible, accurate analysis requires specialized knowledge and experience. Consulting a qualified technician is recommended.
2. What should I do if I notice unusual patterns in my car diagnostics graphics?
Contact a mechanic or diagnostics specialist to investigate the issue further.
3. Are car diagnostics graphics always accurate?
While generally reliable, graphics are only as accurate as the data they receive. Sensor malfunctions or ECU errors can affect accuracy.
4. Can car diagnostics graphics help prevent costly repairs?
Yes, regular analysis can help identify potential issues early on, preventing them from escalating into major and expensive repairs.
5. What is the future of car diagnostics graphics?
As technology advances, we can expect even more sophisticated graphics with enhanced data visualization and analysis capabilities.
Conclusion
Car diagnostics graphics have become indispensable tools in modern vehicle diagnostics. Their ability to visually represent complex data allows technicians to quickly and accurately diagnose car problems, leading to faster repairs, reduced costs, and improved overall vehicle maintenance. Understanding the basics of car diagnostics graphics empowers car owners to engage more effectively with their mechanics and make informed decisions about their vehicles.
For all your car diagnostics needs and to access a wealth of information on related topics, visit DiagFixPro today. We are your trusted partner in keeping your vehicle running smoothly.
Mobile car diagnostics auto electrician mechanic bradford leeds
Need immediate assistance with your car’s diagnostics? Our team of experts is available 24/7 to answer your questions and provide support. Contact us via WhatsApp: +1(641)206-8880 or Email: [email protected].

